Get faster on the same hours you already train.
4 weeks of short lessons and a 12-page workbook that turn your own training into trusted data. By the end you can name your thresholds by feel and hold them without blindly trusting a screen.
- 18 video lessons across four weeks and a capstone, under two hours of video in total
- The 12-page workbook where you build your own effort database, day by day
- Your personal effort playbook, the one page you carry into every race after this
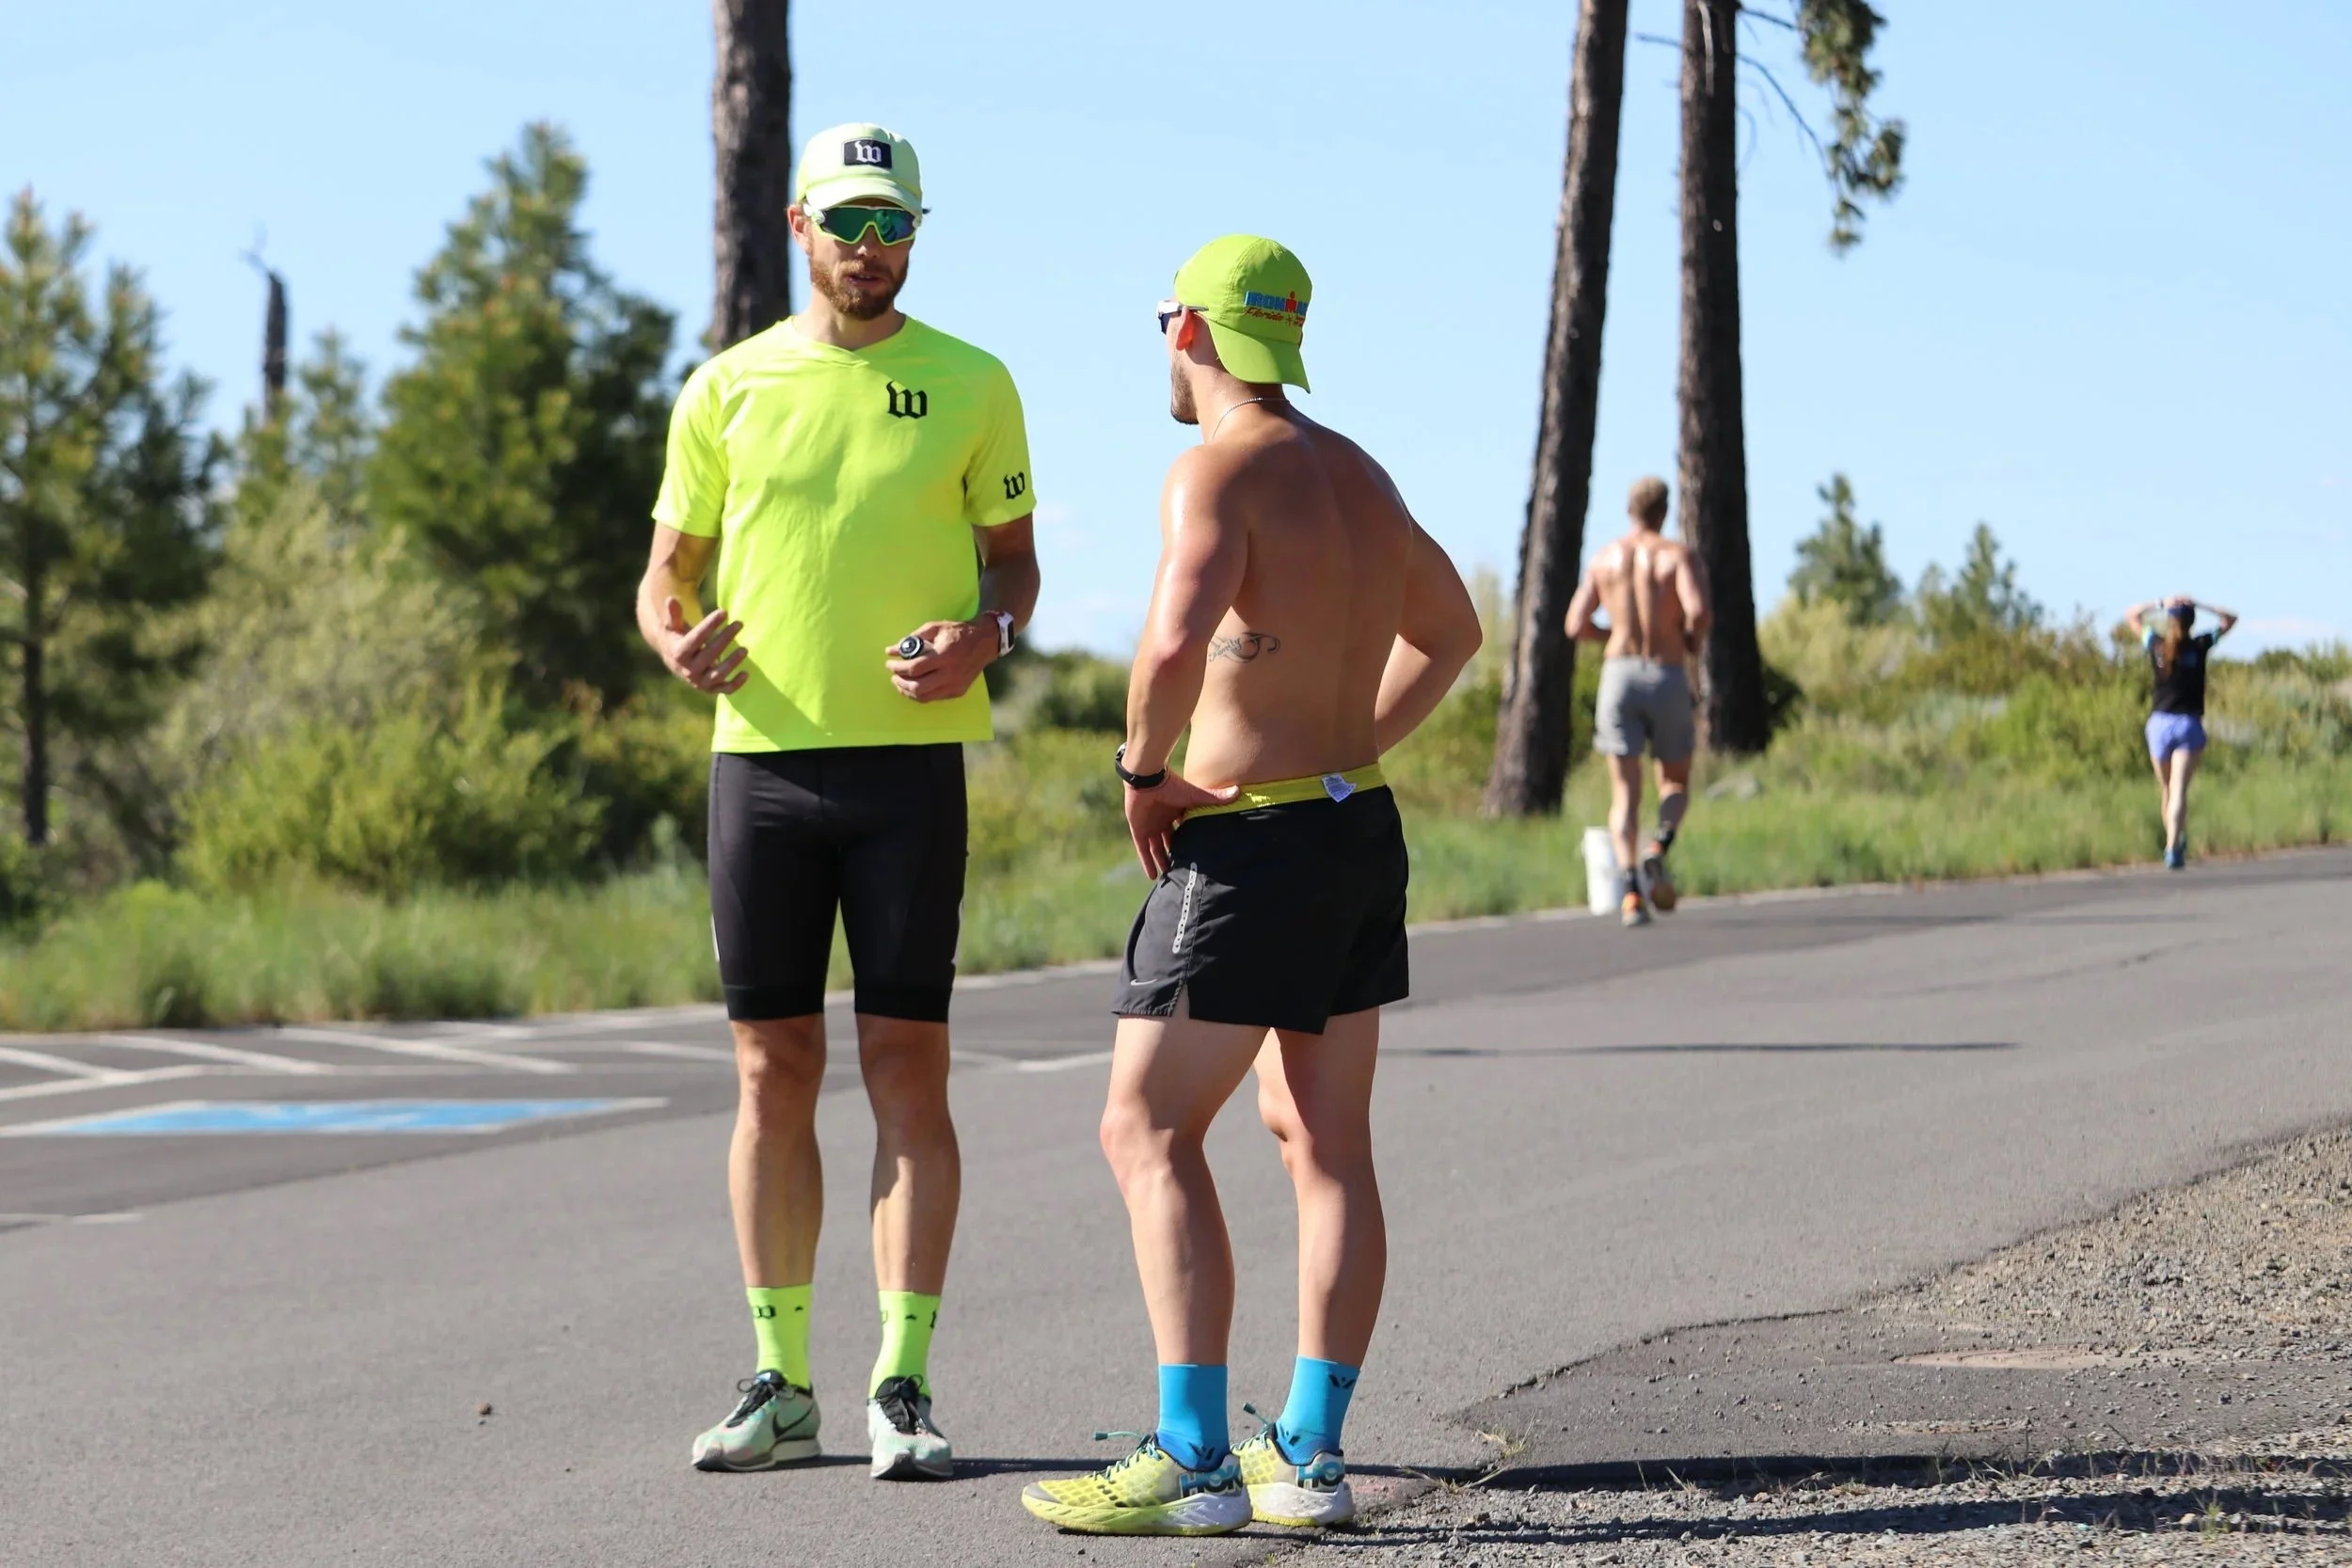

 Taught by Chris Bagg
USAT Level II Coach
20 years coaching
8:35 Ironman
Taught by Chris Bagg
USAT Level II Coach
20 years coaching
8:35 Ironman
There is a place your training hours go to die, and most athletes live in it.
It is the intensity range that sits between easy and hard. Too hard to be easy, too easy to be hard. It feels like training and it looks respectable on Strava, which is exactly why nobody catches it. For a developing athlete it generates real fatigue without forcing much adaptation, so it quietly eats the recovery you needed for the work that counts.
Harder work is not the answer here, and neither is a better device. What changes it is being able to feel where that range starts and ends, which is what this course exists to teach.

Three ranges build the engine. The one in the middle bills you like hard training and pays out like easy training.
So why does it keep happening to careful, well-equipped athletes?
Because your devices are honest about output and know nothing about the price. Heat, thin sleep, and accumulated fatigue all change what a given number costs you today, so the pace your watch calls easy on a cooked Thursday is sitting right in the middle.
Underneath that, every zone you own hangs off a single threshold number, and there is a good chance yours is too high. When Andy Coggan wrote the twenty-minute test, it opened with an all-out five-minute effort immediately before the twenty-minute piece. Almost everybody dropped that step. Ride the twenty minutes fresh and you hold more power than the protocol was built to measure, so the number comes out inflated before you ever subtract the five percent.
One wrong peg moves every zone hanging off it. Call your FTP 300 watts when it is not, put the top of your endurance range at 75 percent of that, and your easy rides now start at 225 watts, which is squarely in the middle. Your hard days stop being hard enough in the same stroke. Count an ordinary week and it shows.
Twenty years of research into how elite athletes actually distribute intensity keeps finding the same shape: around eighty percent genuinely easy, most of the rest genuinely hard, strikingly little in between.
What the course actually does about it.
Three problems, three fixes, taught in the order they need to be learned.
Understand what effort actually means
Week 1 hands you a scale anchored in body markers rather than vibes: your breathing, your muscular tension, and what you can still say out loud. Then you train a full week on feel alone and check yourself against the data afterward.
Week 1 · 4 lessonsTen levels, each with its own body markers
Anchor the landmarks in your own numbers
Weeks 2 and 3 find LT1 and LT2 by feel, then pin your own power, pace, and heart rate to them. No formula and no percentage of a number an app guessed back in March. Yours, measured on you, in the conditions you actually train in.
Weeks 2 and 3 · 6 lessonsAnd you can find it again in five minutes, on any day, with a dead watch.
Example figures. Yours come out of your own logs.
Turn it into a race-day playbook
Week 4 maps effort to every race distance, and you write the one page you carry from here on. Your scale in your own words, your numbers beside it, your targets by distance, and what heat and tired legs do to all of it.
Week 4 · 4 lessonsAbove 85°F, expect heart rate 10 to 12 beats higher at the same effort. Hold the effort, let the numbers move.
Example figures. Yours come out of your own logs.
By the end of the month you will know exactly how hard to go.
- Rate any effort from body cues, without looking at a screen
- Say what you produce at a given effort, and how heat and fatigue bend it
- Hold a target effort for hours without drifting off it
- Audit a week and know what percentage landed in each range
- Pace a race by effort and finish it the way you meant to
Fatigue is not weakness showing up. It is data arriving.
Effort and fatigue are two separate dials, so the workbook rates them separately, one dot each, every day. Plot a fortnight of that and a pattern shows up that no single session could tell you. If effort holds steady while fatigue climbs underneath it, the two are decoupling, and a five out of ten day is quietly costing you what a seven used to.
That is your brain adding up training, work, sleep, heat and everything else you are carrying, and handing you one honest number. Override it and you can execute the plan perfectly for months while getting slower. Read it instead and you take the day, which is the harder choice and the faster one.
Training does not happen on the bike. What you do on the bike is stimulus. Training happens on the couch while you are resting. Chris Bagg's first coach, quoted in lesson 3.3.
The other tell runs the opposite way. A sixty minute run that always sits at five out of ten comes in at eight, and you drag the whole way.
Weeks 3 and 4 · two dots a day, then connect them
Four weeks that fit inside the training you already do
Fifteen minutes of video at the top of the week, two minutes in the workbook after each session, and nothing about your actual training changes.
Here is what's inside
Each one is a short video with the key idea written out underneath it and that week's assignment at the bottom. Open any chapter to see what is inside.
00 Start here The rhythm of the month, and the workbook that carries it. 2 lessons · about 10 min
Week 01 Meet the grey zone Name the villain, learn the language of effort, then train a full week by feel alone. 4 lessons · about 25 min
Week 02 Connect inputs to outputsYour effort database Why your devices lie, and how to build the chart that tells you what your own numbers mean. 3 lessons · about 16 min
Week 03 Anchor LT2 by feel Poke the ceiling. Find your real threshold with no formula, and learn why the flattering number makes you slower. 3 lessons · about 17 min
Week 04 Race with command The effort map by distance, the energy cascade, and devices demoted from drivers to backstops. 4 lessons · about 20 min
Capstone Racing in the grey zone Why the grey zone is where you actually race, and the season map that decides when you are allowed back into it. 2 lessons · about 15 min
Then the course argues with itself.
You may have spotted the problem already. If the middle is where training hours go to die, why is a 70.3 run almost entirely inside it? Chris raises it himself in week 4, tells you to hold the thought, and then spends the capstone answering it.
The grey zone is a season decision, not a permanent verdict. You stay out of it while you are building the engine, because that is when it costs the most and returns the least. Then, in the last two or three months before a goal race, you move back in on purpose, at an intensity well above the one you left, because the race demands hours of exactly that and nothing else trains it.
The last lesson turns that into a calendar. Not the four weeks you just bought. The year you are going to spend them on.
Races cluster inside about a month because peak fitness does not hold much longer than that. The off season carries fourteen days completely off. Newer athletes want the longer base, experienced ones can cut it to two or three months.
Lesson 5.2 · an annual plan, not a final block

This is where the work actually happens.
Everything the lessons teach only turns into a result once it lands in here.
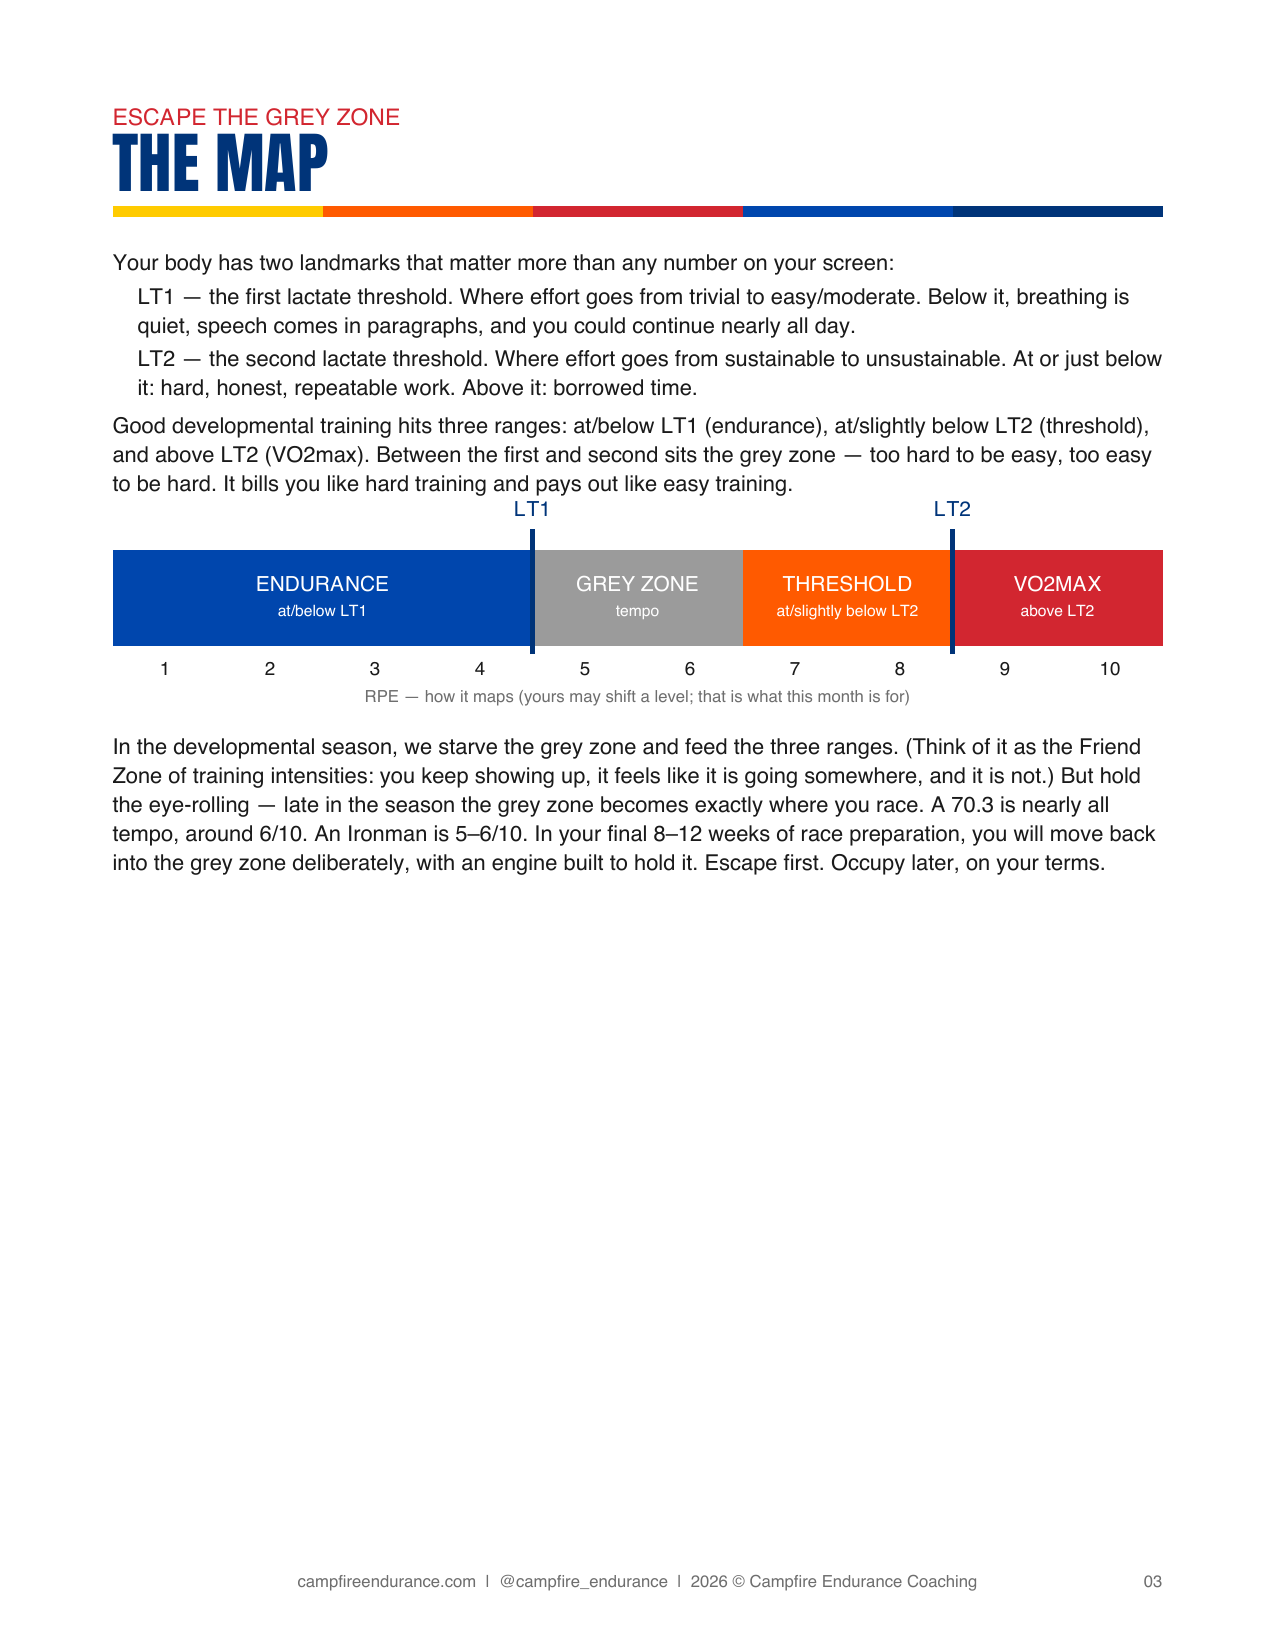
- The map. LT1, LT2, and the three productive ranges on one scale, so you always know where you are standing.
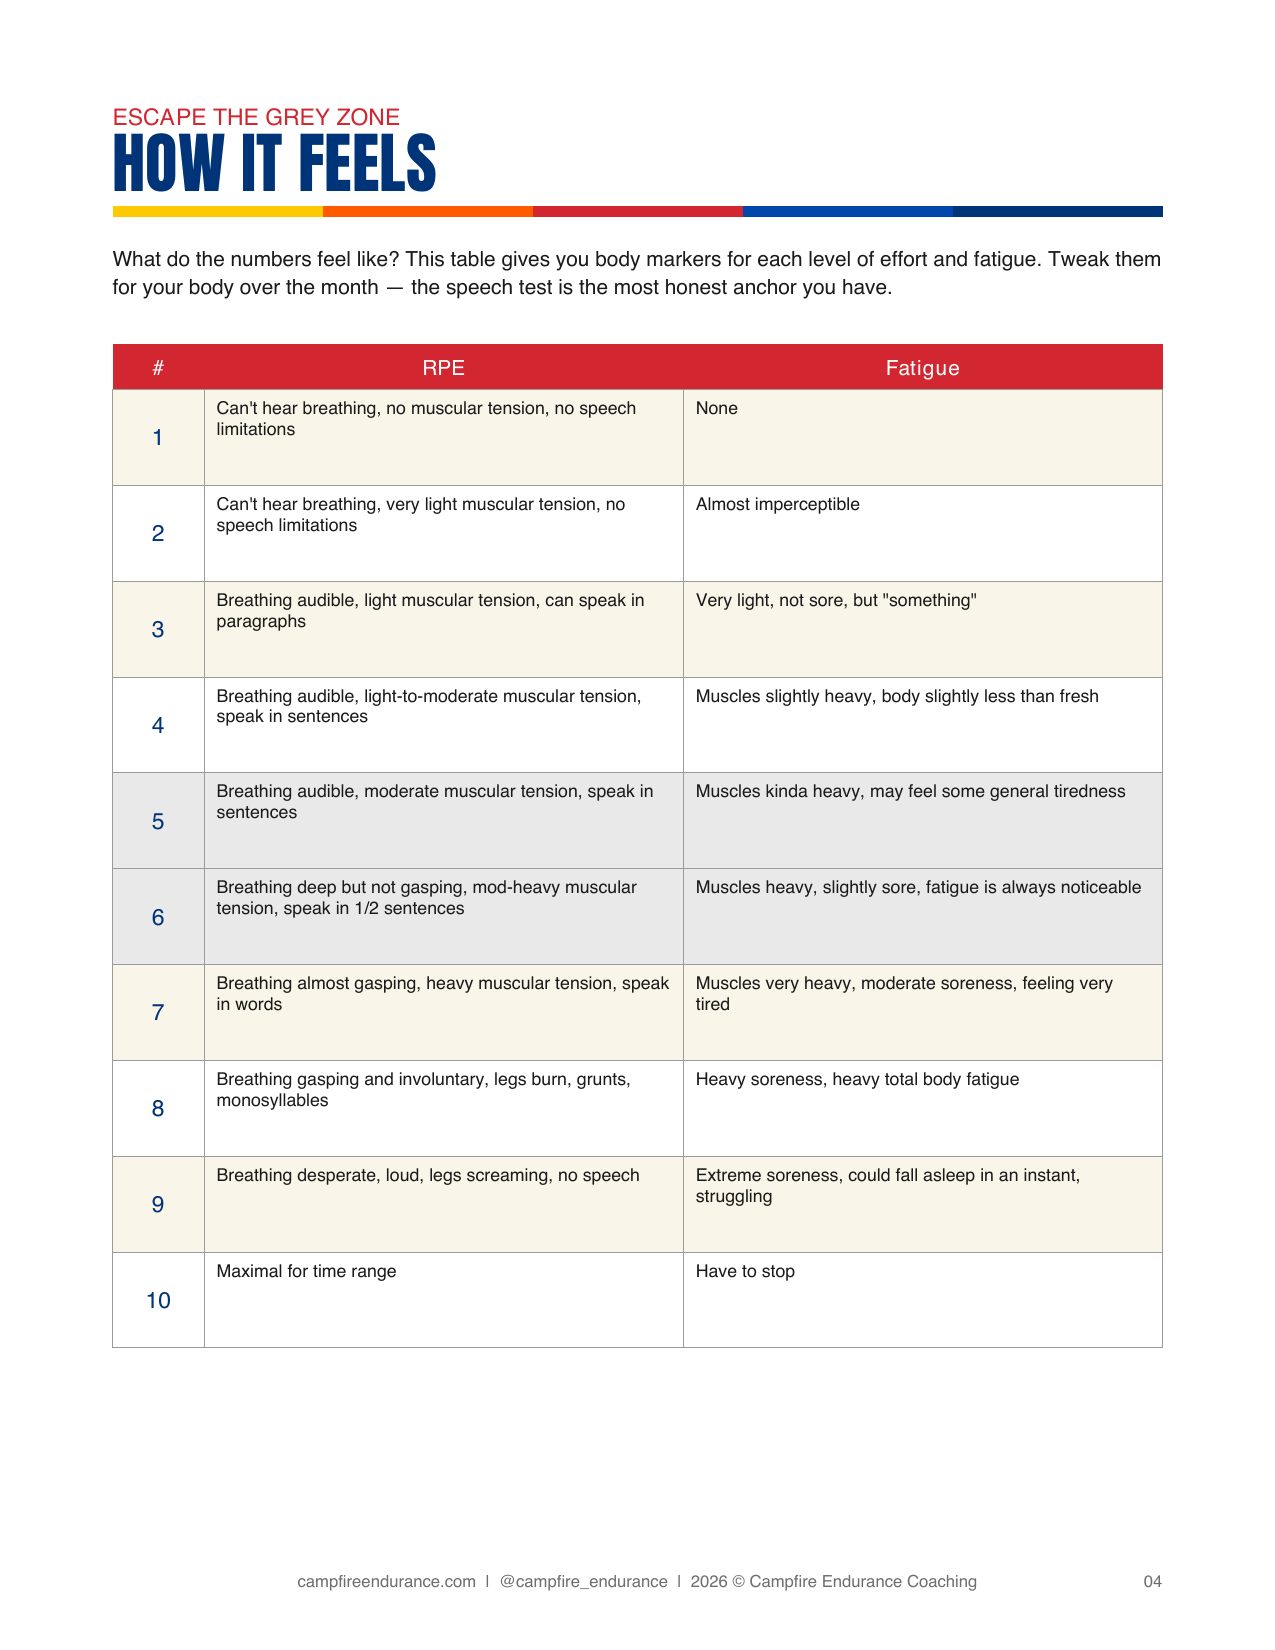
- How it feels. Body markers for every level from one to ten. Breathing, muscular tension, and the speech test.
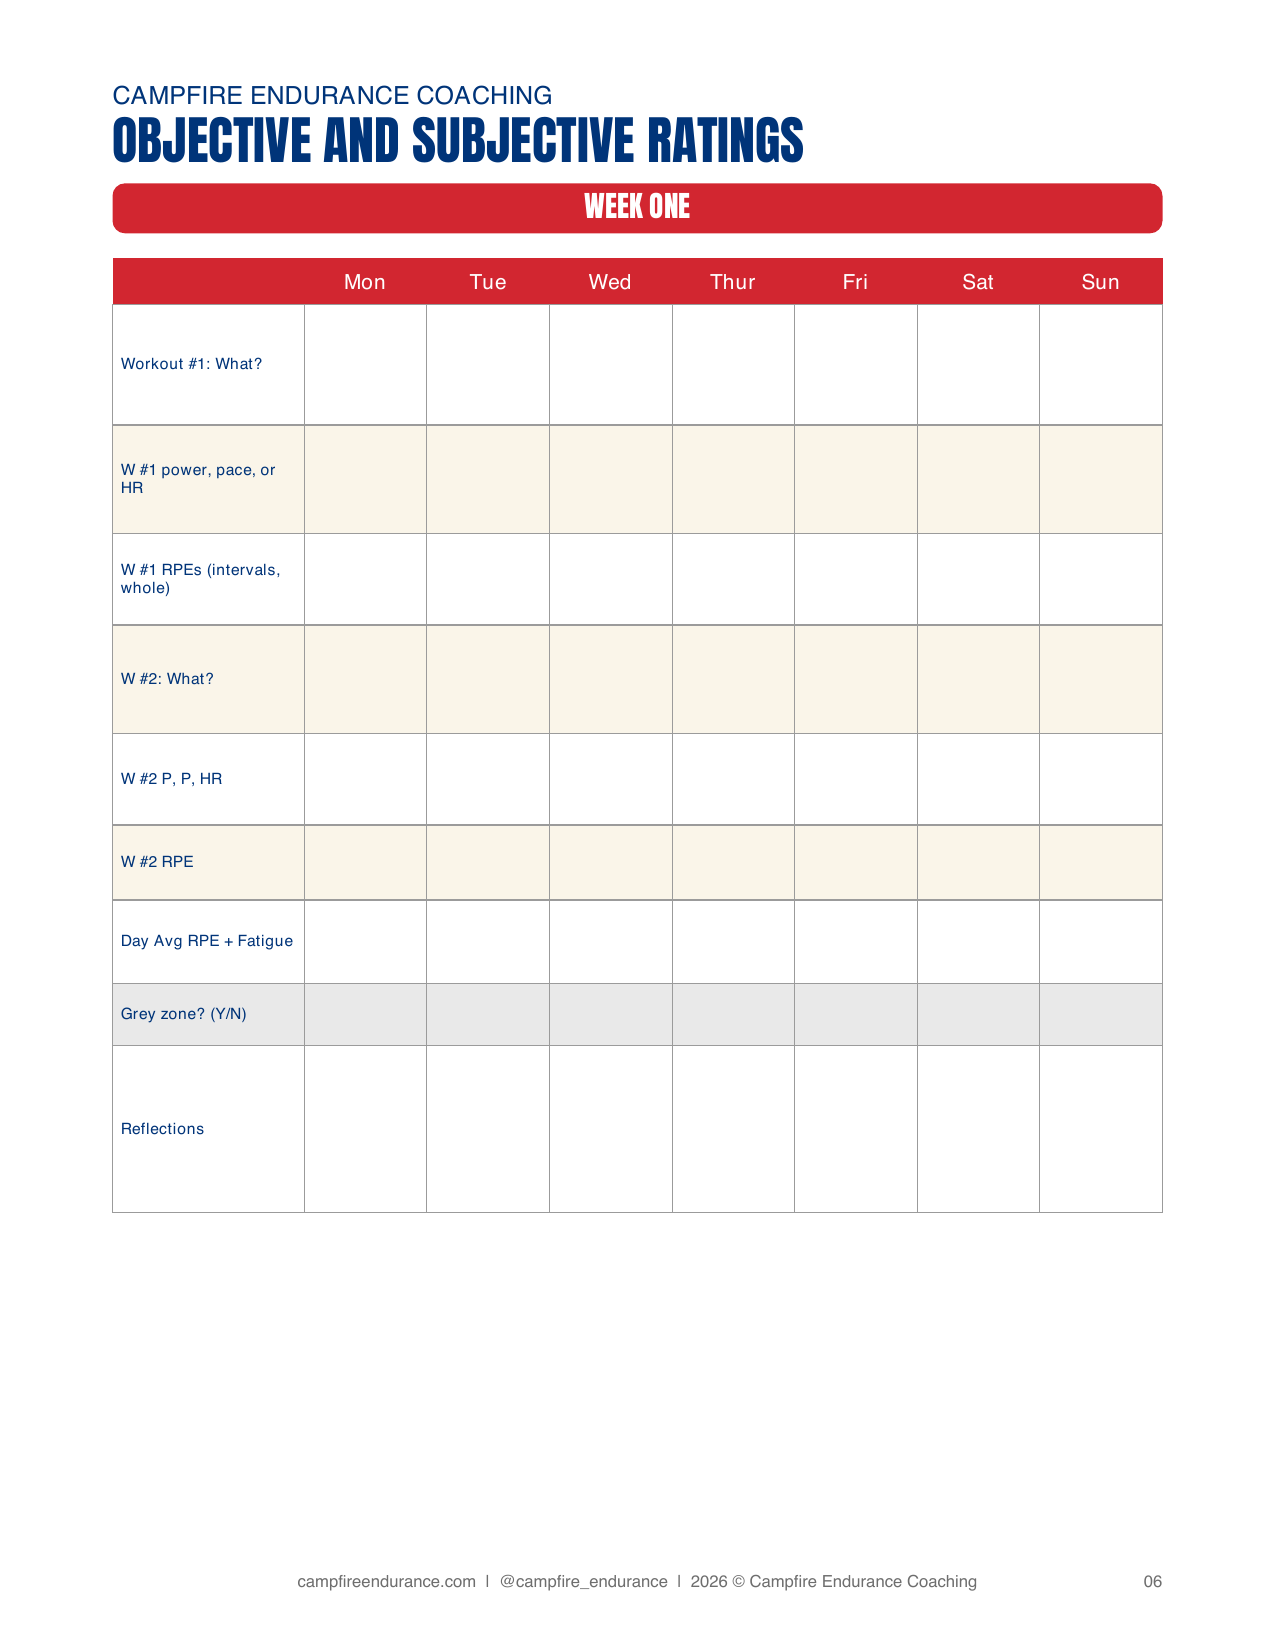
- Four weekly worksheets. Workout, numbers, effort, fatigue, and an honest yes or no in the grey zone column.
- The graph. One month on one page. The shaded band is the grey zone, and you will see your month pooling in it.


Chris Bagg has been teaching this for decades.
He has coached for two decades, and raced as a professional triathlete for fifteen of those years, with an 8:35 Ironman to his name. The conviction underneath all of it has not moved: the best athletes are the best decision makers, and you cannot make a good decision if you do not know what your effort means to your body.
This month of work is not a side project for him. It is how every athlete at Campfire starts, on the intake call, before anyone writes a single workout. The course is that beginning, made self-paced so you can do it without hiring him.
What athletes say about working with Chris.
Finally having the real data was a relief, and Chris reads it in a way that actually fits my goals. I recommend it without hesitation.

It feels more like a family than a training event. I am stronger, more confident, more motivated, and faster and healthier because of it.
Educational, supportive, and never once judgmental. As a beginner I learned so much, and I never felt ashamed of my ability.
Stop spending your hours in the
one range that bills like hard work
and pays out like easy work.

- 18 video lessons and every weekly assignment
- The 12-page workbook, yours to download and print
- Yours for good, at whatever pace you want, every season

You are already putting in the hours. This is about where they go.
Give it four weeks and you will know exactly how hard to go, in training and on race day, whether or not the watch is working.