
FTP is Good—Fatigue Resistance is Better
Start measuring a more pertinent metric in search of performance

Ed. Note—Coach Chris (looking rather grim, above) raced the Shasta Gravel Hugger this past weekend and…didn’t have the best day. That got us thinking about fatigue resistance. Don’t be like Chris in your races—respect the distance, do the proper preparation, and then don’t ride like a Broheim. Scroll down for a much happier Coach Molly, who did a much better job sticking to her abilities and her race plan.
Functional Threshold Power (FTP) has long been the god statistic when talking about cycling performance. Strike up any casual conversation about training with cyclists, and soon enough the subject meanders around to comparing FTP size. Mine’s 370 right now, says Broheim, confidently, as he’s tossing a leg over his Pinarello and quaffing the dregs of his pour-over. Unfortunately for Broheim, those three digits don’t mean as much as he’d like them to mean. As the old saying goes, it’s not the size that matters—it’s how you use it. Most cyclists, we opine, arrive at their FTP incorrectly, and then don’t know how to utilize their power threshold effectively. Today we aim to fix that by introducing (re-introducing, really) a more useful concept: fatigue resistance.
Fatigue resistance has been making the rounds recently, as a new generation of coaches try to discern what the best in the world do during races. What those coaches have found is that once you standardize a population of athletes in terms of FTP, the trait that matters most is how long they can maintain certain percentages of that FTP, or how many times they are able to repeat a certain number of hard efforts. The cycling world has been the quickest to adopt fatigue resistance as the metric of choice, with coaches tracking riders’ capacities to perform as close to their fresh numbers as possible when fatigued. When you consider that many cyclists race dozens of times each year (as opposed to triathletes, who often race only a handful of times), and that cycling races are sometimes multi-day affairs, you can see why durability rises to the top of a list of desirable traits.
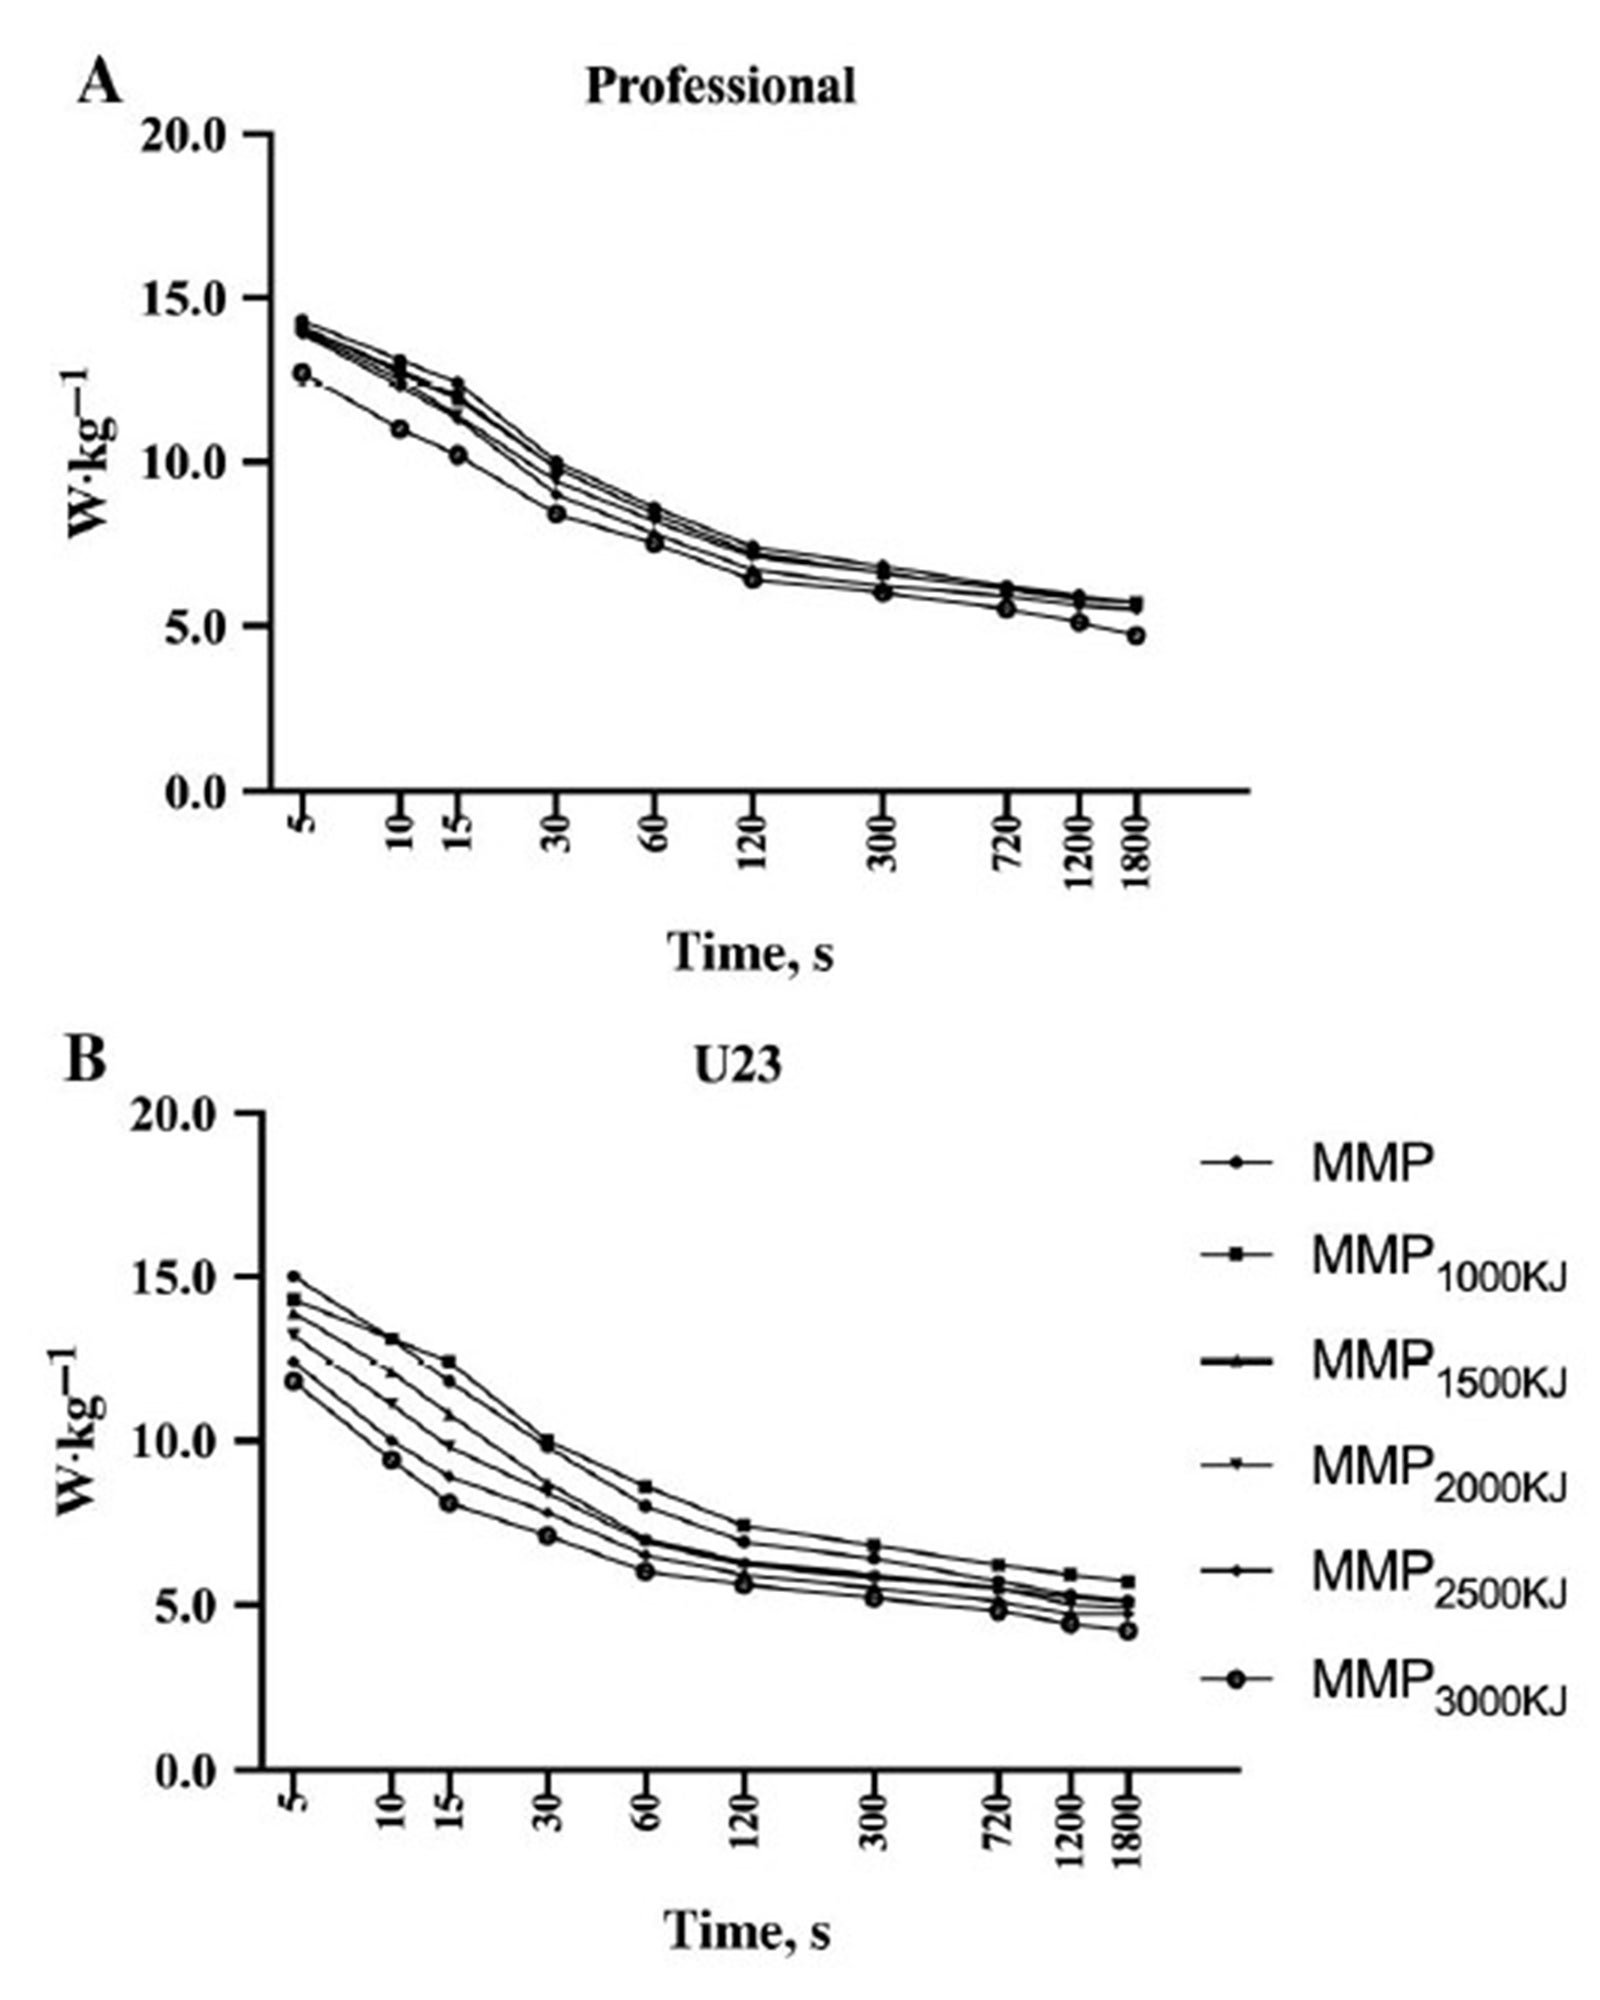
The fatigue resistance of professional versus U-23 cyclists
Here you can see the fatigue resistance of two populations, as measured in a study by Leo and Spragg in the Journal of Physiology and Performance. The top graph represents full-time professionals, while the bottom graph shows under-23 athletes (typically younger than full-time pros). Each of the lines on the graph represents a certain amount of work done, measured in Kilojoules (KJ). Those lines were 1000 KJ, 1500 KJ, 2000 KJ, 2500 KJ, and 3000 KJ. You may not know this, but your power meter does a great job of recording the work you’ve done, also measured in KJs. What you see in the top (full-time professional) graph is that the lines are closely grouped together—so closely you can’t tell the different lines apart. That grouping means that full-time professionals perform almost as well after burning 3000 KJ than they did when they were fresh! The U-23 riders, in contrast, see lines that begin to drift apart. This means that their performance suffered as they rode longer, harder, or both. What’s the big difference between U-23 cyclists and professional athletes? Most of the time it’s just…time. Many of those U-23s will keep riding, and by the time they are in their late 20s they will see improvements up to the level of their professional peers.
So what does this mean for us as triathletes? Triathlon, much more so than cycling, is less about achieving big numbers and more about slowing down as little as possible. You hear that, Broheim? Your 370 FTP doesn’t matter if you can’t hold a high percentage of it for as long as possible. Let’s compare Broheim with his much less cocky younger brother, Broseph.
Broheim
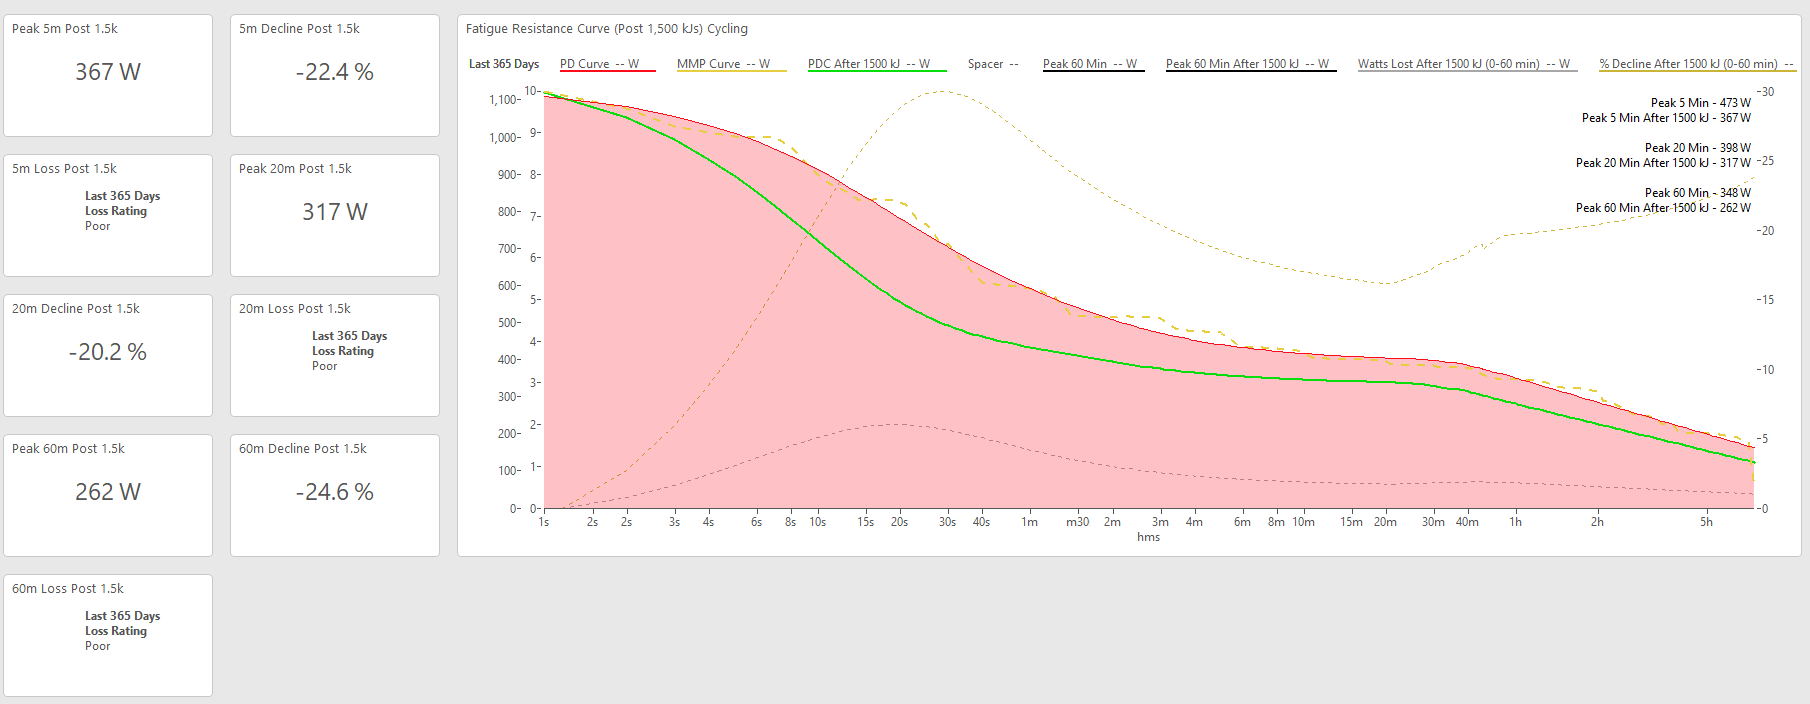
Broheim’s fatigue resistance chart
FTP: “370” (but probably more like 355)
Best 60 minute Mean Maximal Power (highest average power recorded for 60 minutes in the last 90 days): 348 (nice work, Broheim! Must have been drinking your macchiato that day)
Best 60 minute MMP after burning 1500 kJ: 262
Percent decline: 25%, which puts Broheim in the “poor” category.
WHY IMPORTANT? So say Broheim wants to do an Ironman. He is certainly going to burn through more than 1,500 kJ on his way to “brag for the rest of your life.” So if Broheim’s ability to hold power drops by 25% after only 1/3 of the Ironman, he’s going to struggle for the rest of the ride (to say nothing about the run). Broheim will probably make things worse by going too hard at the beginning of the ride, too, since “I dunno, man, I felt good at the time.”
HOW WE CAN HELP BROHEIM: First of all, Broheim, you need to stop trying to swing your FTP around—clearly it’s not helping you. What you need to do is ride your bike more, and develop some durability by increasing your endurance. This means riding longer at certain intensities, not just riding harder all the time. Also—pace your bike rides better. Don’t burn through so many kJs at the beginning of your rides.
Broseph

Broseph’s much better fatigue resistance chart
FTP: 295 (accurate)
Best 60 minute MMP: 275
Best 60 minute MMP after burning 1500kJ: 227
Percent decline: 17%, which puts Broseph in the “average” category
Why important: Broseph fatigues less than his older brother after spending 1,500 kJs, a fact you can see by the closeness of the red line (his “fresh” power duration curve” and the green line (his power duration curve after 1,500 kJ). Since getting fatigued is akin to slowing down, Broseph is going to spend less energy on the bike, slow down less, and have more energy available for the run.
HOW WE CAN HELP BROSEPH: Broseph can also benefit with more aerobic development (i.e. more riding) and continuing to lengthen his intervals rather than making them higher all the time, but Broseph is in a pretty good spot at the moment.
how to do this yourself
OK, this won’t be comfortable, but true development never is. First of all, we want you to go out there and ride as hard as you can for an hour. Yup. You heard us right. Nope, it’s not a test. Just ride as strongly as you can for 60 minutes and measure your average power for that amount of time. If you use WKO5 or another program like Golden Cheetah it will capture the information for you. Heck, find a 60’ Zwift race if you must, since there’s a lot of that going around. However you do it, record what you did. This is your 60-minute mean maximal power. Now, a week or so later, here’s what you’re going to do:
Go out and ride around, tracking your kilojoules burned on your bike computer
When you get to 1,500 kJ, stop and eat something.
Ride as hard as you can for 60 minutes, recording the average power.
This number is your Peak 60 Minute MMP after 1,500 kJ
Divide the smaller number by the larger number (you’ll get some decimal less than 1.0, like .78 or something)
Subtract that number from 1.0 and multiply by 100
You have your % decline from fresh
Now you can see how you did.
If you fatigued less than 10% that’s pretty remarkable—you are very fatigue resistant already. You are probably best suited at trying to raise your FTP
If you fatigued 10-20% you are in the “average” category, and you should make sure you are doing plenty of long rides at a moderate effort, and your tempo, sweet spot, and FTP-style intervals should aim at going longer, not higher.
If you fatigued more than 20% you are in the “poor” category. You really need to spend your time simply riding more. Intervals will help, but they should mostly be high endurance (around 70-75% of FTP), tempo (76-85% of FTP), or sweet spot (85-95% of FTP) and you should also focus on making them longer rather than higher.

Same spot, much happier!
conclusion
Above you can see Coach Molly at the same spot of the Shasta Gravel Hugger. Smiling, even, while Coach Chris had on the “1000-yard-stare-of-death.” Coach Molly has been riding more than enough to have success at this race, and she stuck to her race plan, fueling appropriately and spending her kilojoules wisely. The result? A much better performance than Chris, and a much better feeling all day. How is this pertinent to triathletes, you might ask? Well, if you don’t work on your fatigue resistance, then you are going to be exhausted coming off the bike. If you’re exhausted coming off the bike, you just won’t run effectively. So be like Broseph, but try not to be like Broheim.
Want to get some help with all of this? If you’re interested in getting guided to better performances, a coach can really help with prescribing these workouts and then analyzing the data. Head on over to our Coaching page to find out how Campfire can help you resist fatigue.